

Income and Expenses (Rs in CR.)
Key Financial Data
| Income | 2016-17 | 2017-18 | 2018-19 | 2019-20 | 2020-21 | 2021-22 | 2022-23 | 2023-24 | 2024-25 |
|---|---|---|---|---|---|---|---|---|---|
| Sale in MU | 4307.40 | 4677.38 | 4606.83 | 5042.30 | 4726.72 | 5133.14 | 5409.55 | 4925.58 | 5142.38 |
| Sale | 597.05 | 631.00 | 590.90 | 744.73 | 766.86 | 735.52 | 1009.51 | 988.71 | 1084.10 |
| Other Income | 49.85 | 43.19 | 42.60 | 40.64 | 29.06 | 36.73 | 35.61 | 49.47 | 48.10 |
| Total | 646.9 | 674.1 | 633.50 | 785.37 | 795.92 | 772.25 | 1045.12 | 1038.18 | 1132.20 |


| Expenses | 2016-17 | 2017-18 | 2018-19 | 2019-20 | 2020-21 | 2021-22 | 2022-23 | 2023-24 | 2024-25 |
|---|---|---|---|---|---|---|---|---|---|
| Consumption of Stores and Spares | 1.63 | 1.69 | 1.34 | 0.97 | 2.07 | 0.56 | 1.24 | 1.23 | 1.05 |
| Repair & Maintenance | 77.32 | 105.34 | 118.82 | 121.83 | 168.02 | 153.33 | 172.12 | 188.66 | 203.24 |
| Employee Remuneration and Benefits | 222.53 | 236.20 | 244.84 | 245.63 | 239.71 | 272.36 | 308.37 | 322.97 | 339.87 |
| Administration & General Expenses | 40.77 | 45.49 | 45.70 | 54.48 | 59.84 | 63.53 | 77.46 | 84.03 | 93.11 |
| Depreciation | 113.32 | 114.95 | 129.02 | 129.18 | 103.64 | 116.04 | 199.76 | 228.74 | 256.44 |
| Interest & Other Charges | 115.10 | 108.64 | 71.75 | 66.14 | 55.86 | 46.72 | 153.04 | 166.65 | 173.13 |
| Total | 570.67 | 612.31 | 611.47 | 618.23 | 629.14 | 652.54 | 911.99 | 992.28 | 1066.84 |


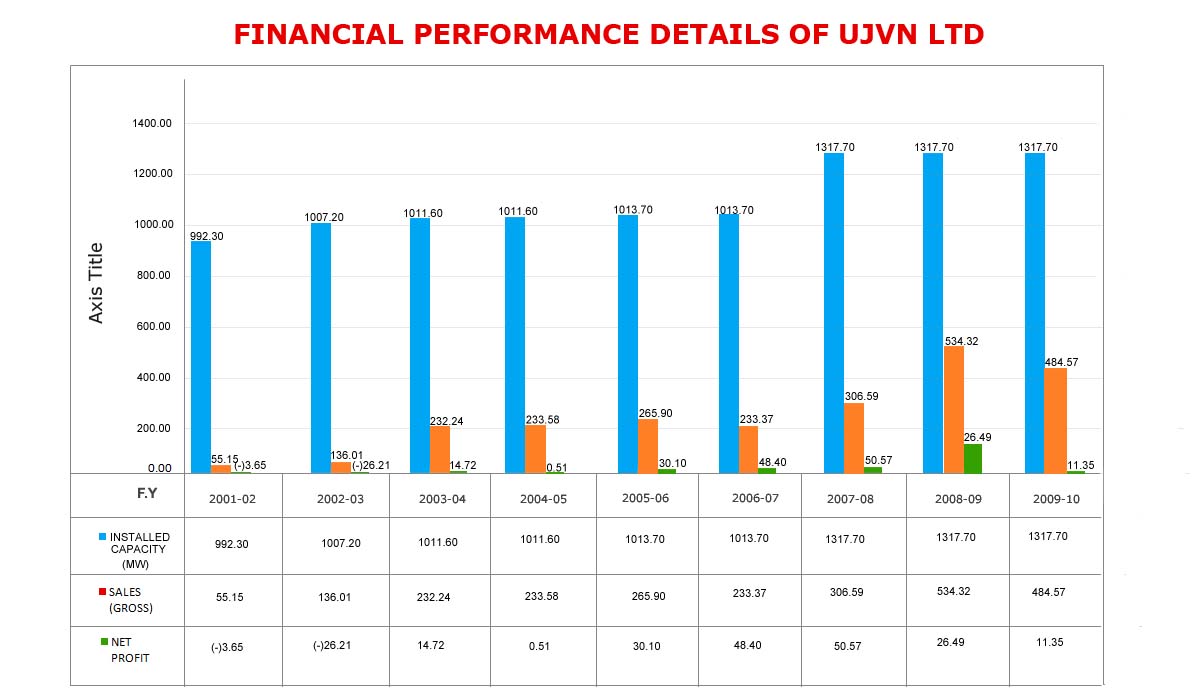
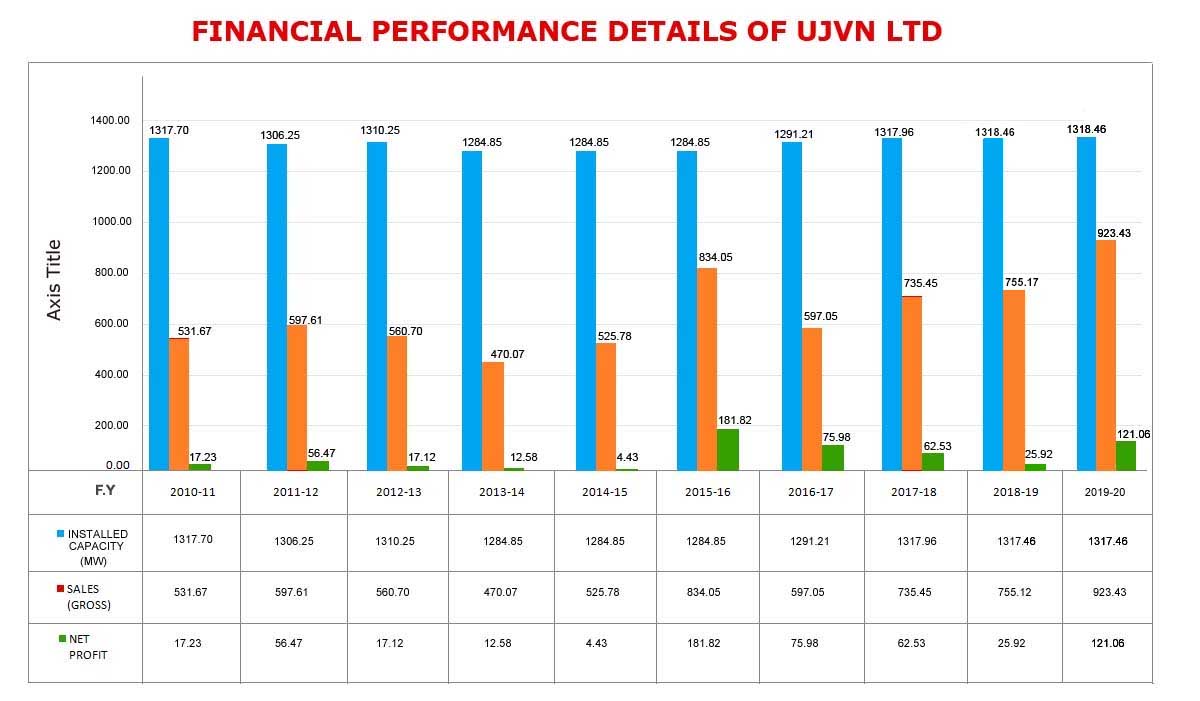
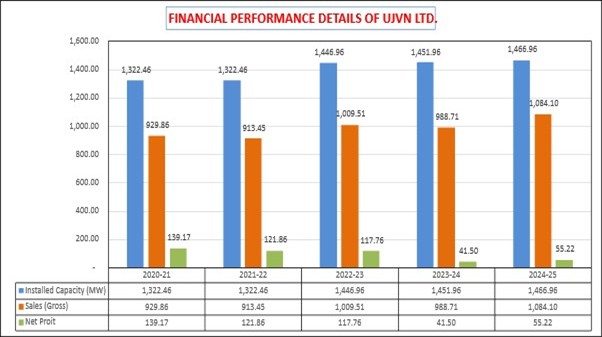
Financial Performance Details of UJVN LTD (Rs in Cr.)
| Particulars | Installed Capacity(MW) | Sales (Gross) | Net Profit |
|---|---|---|---|
| 2024-25 | 1466.96 | 1084.10 | 55.22 |
| 2023-24 | 1451.96 | 988.71 | 41.50 |
| 2022-23 | 1446.96 | 1009.51 | 117.76 |
| 2021-22 | 1322.46 | 913.45 | 121.86 |
| 2020-21 | 1322.46 | 929.86 | 139.17 |
| 2019-20 | 1318.46 | 923.43 | 121.06 |
| 2018-19 | 1318.46 | 755.17 | 25.92 |
| 2017-18 | 1317.96 | 735.45 | 62.53 |
| 2016-17 | 1291.21 | 597.05 | 75.98 |
| 2015-16 | 1284.85 | 834.05 | 181.82 |
| 2014-15 | 1284.85 | 525.78 | 4.43 |
| 2013-14 | 1284.85 | 470.07 | 12.58 |
| 2012-13 | 1310.25 | 560.70 | 17.12 |
| 2011-12 | 1306.25 | 597.61 | 56.47 |
| 2010-11 | 1317.70 | 531.67 | 17.23 |
| 2009-10 | 1317.70 | 484.57 | 11.35 |
| 2008-09 | 1317.70 | 534.32 | 26.49 |
| 2007-08 | 1317.70 | 306.59 | 50.57 |
| 2006-07 | 1013.70 | 233.37 | 48.40 |
| 2005-06 | 1013.70 | 265.90 | 30.10 |
| 2004-05 | 1011.60 | 233.58 | 0.51 |
| 2003-04 | 1011.60 | 232.24 | 14.72 |
| 2002-03 | 1007.20 | 136.01 | (-)26.21 |
| 2001-02 | 992.30 | 55.15 | (-)3.65 |
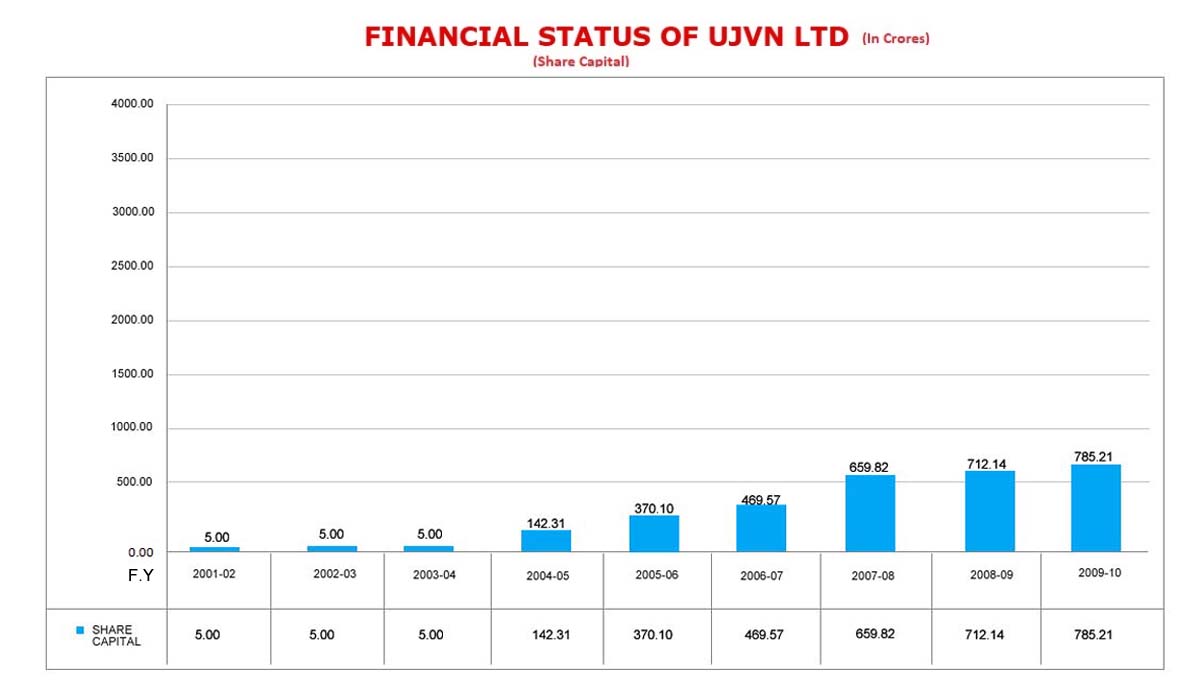
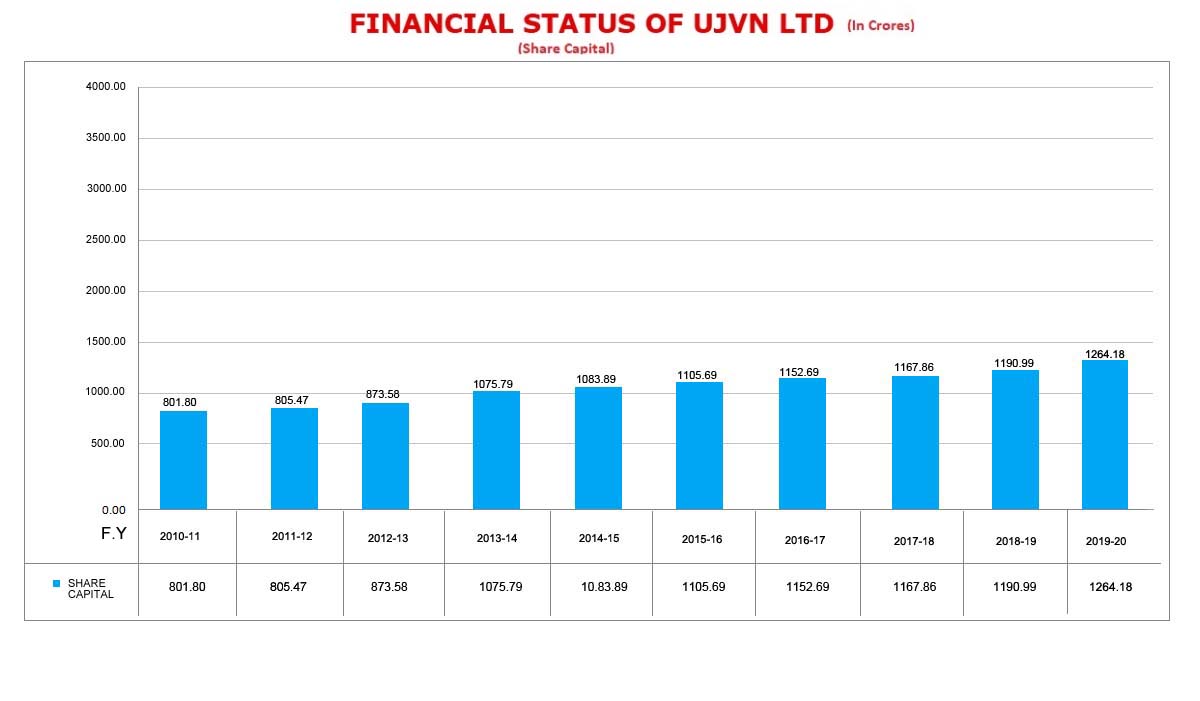
Key Financial Status of UJVN LTD (Rs in Cr.)
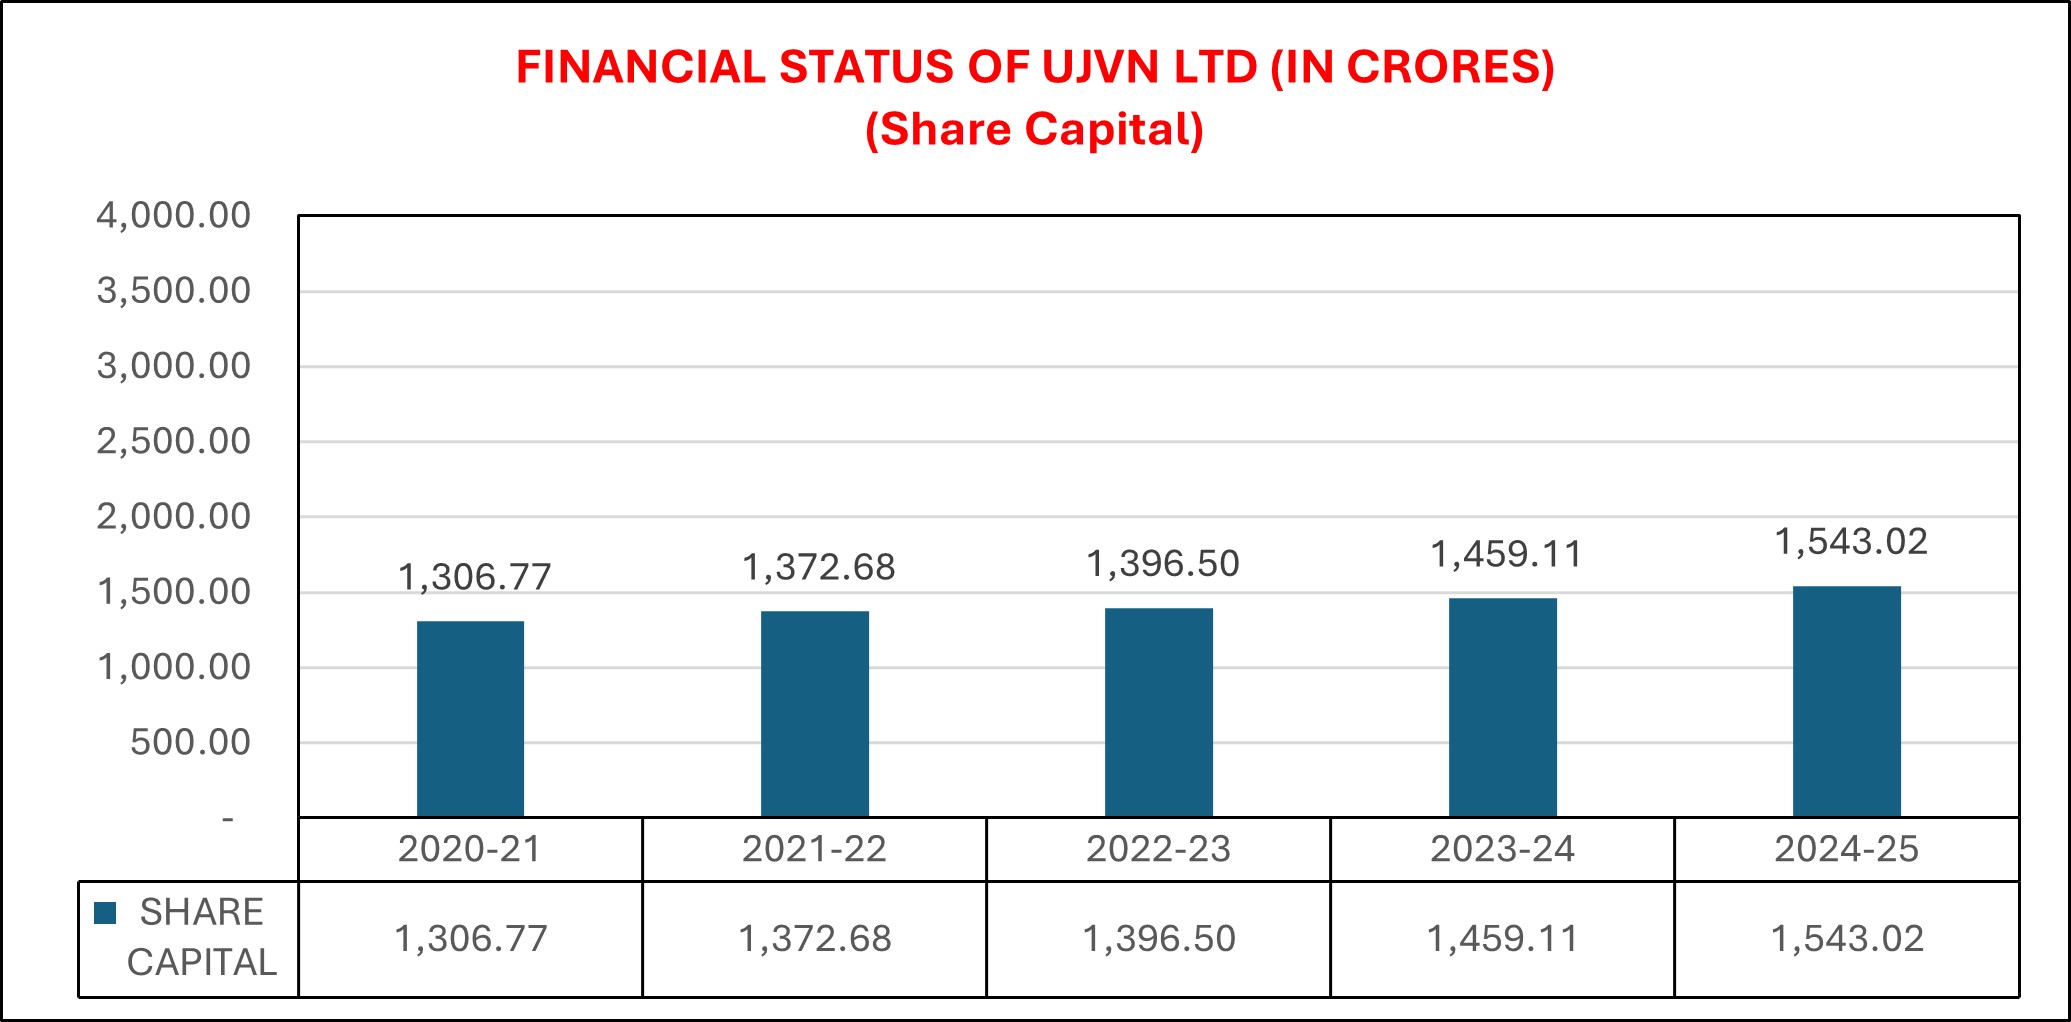
| Particulars | Share Capitals |
|---|---|
| 2024-25 | 1543.02 |
| 2023-24 | 1459.11 |
| 2022-23 | 1396.50 |
| 2021-22 | 1372.68 |
| 2020-21 | 1306.77 |
| 2019-20 | 1264.18 |
| 2018-19 | 1190.99 |
| 2017-18 | 1167.86 |
| 2016-17 | 1152.69 |
| 2015-16 | 1105.69 |
| 2014-15 | 1083.89 |
| 2013-14 | 1075.79 |
| 2012-13 | 873.58 |
| 2011-12 | 805.47 |
| 2010-11 | 801.80 |
| 2009-10 | 785.21 |
| 2008-09 | 712.14 |
| 2007-08 | 659.82 |
| 2006-07 | 469.57 |
| 2005-06 | 370.10 |
| 2004-05 | 142.31 |
| 2003-04 | 5.00 |
| 2002-03 | 5.00 |
| 2001-02 | 5.00 |
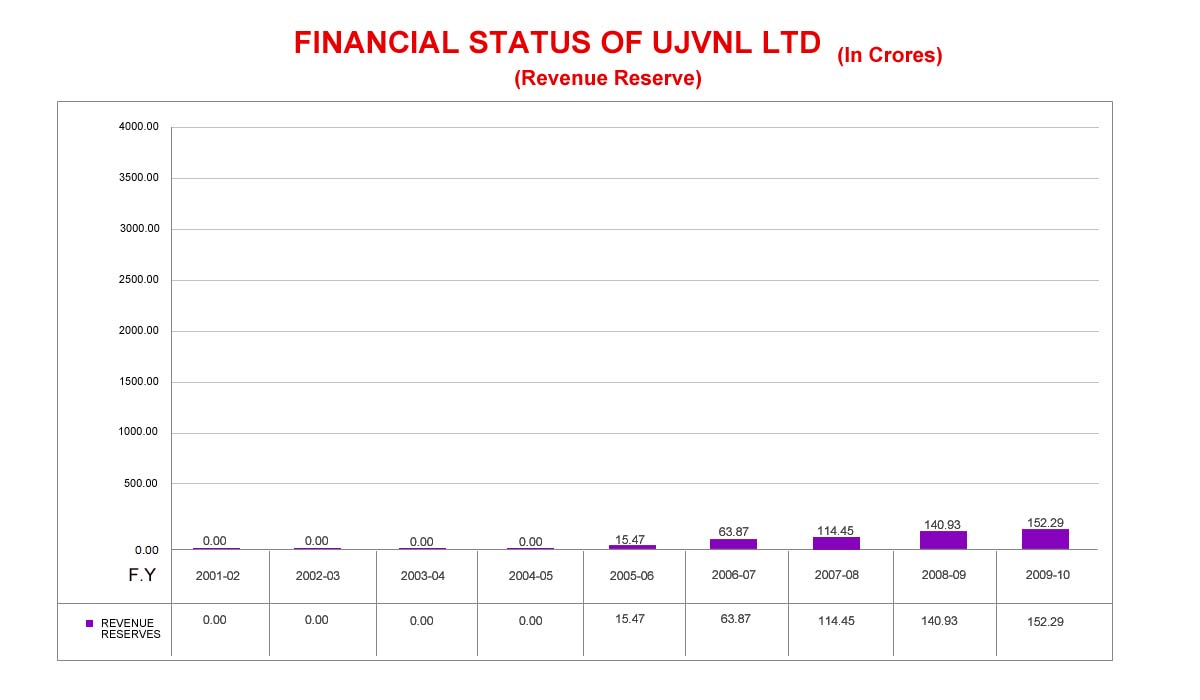
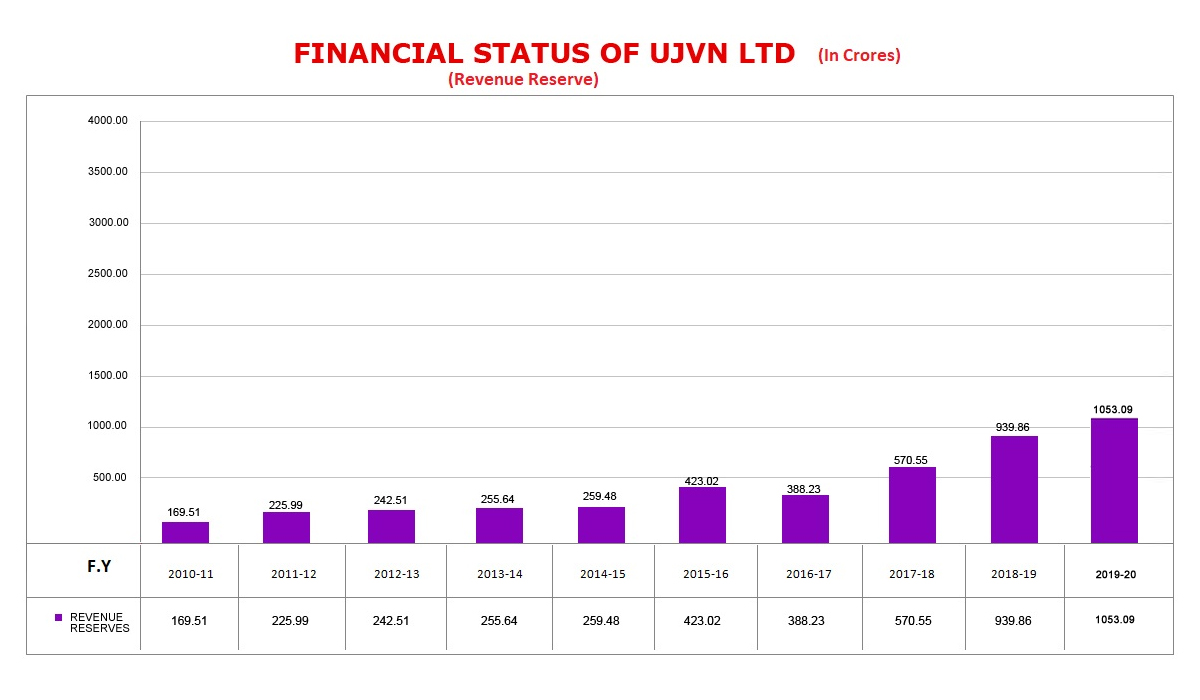
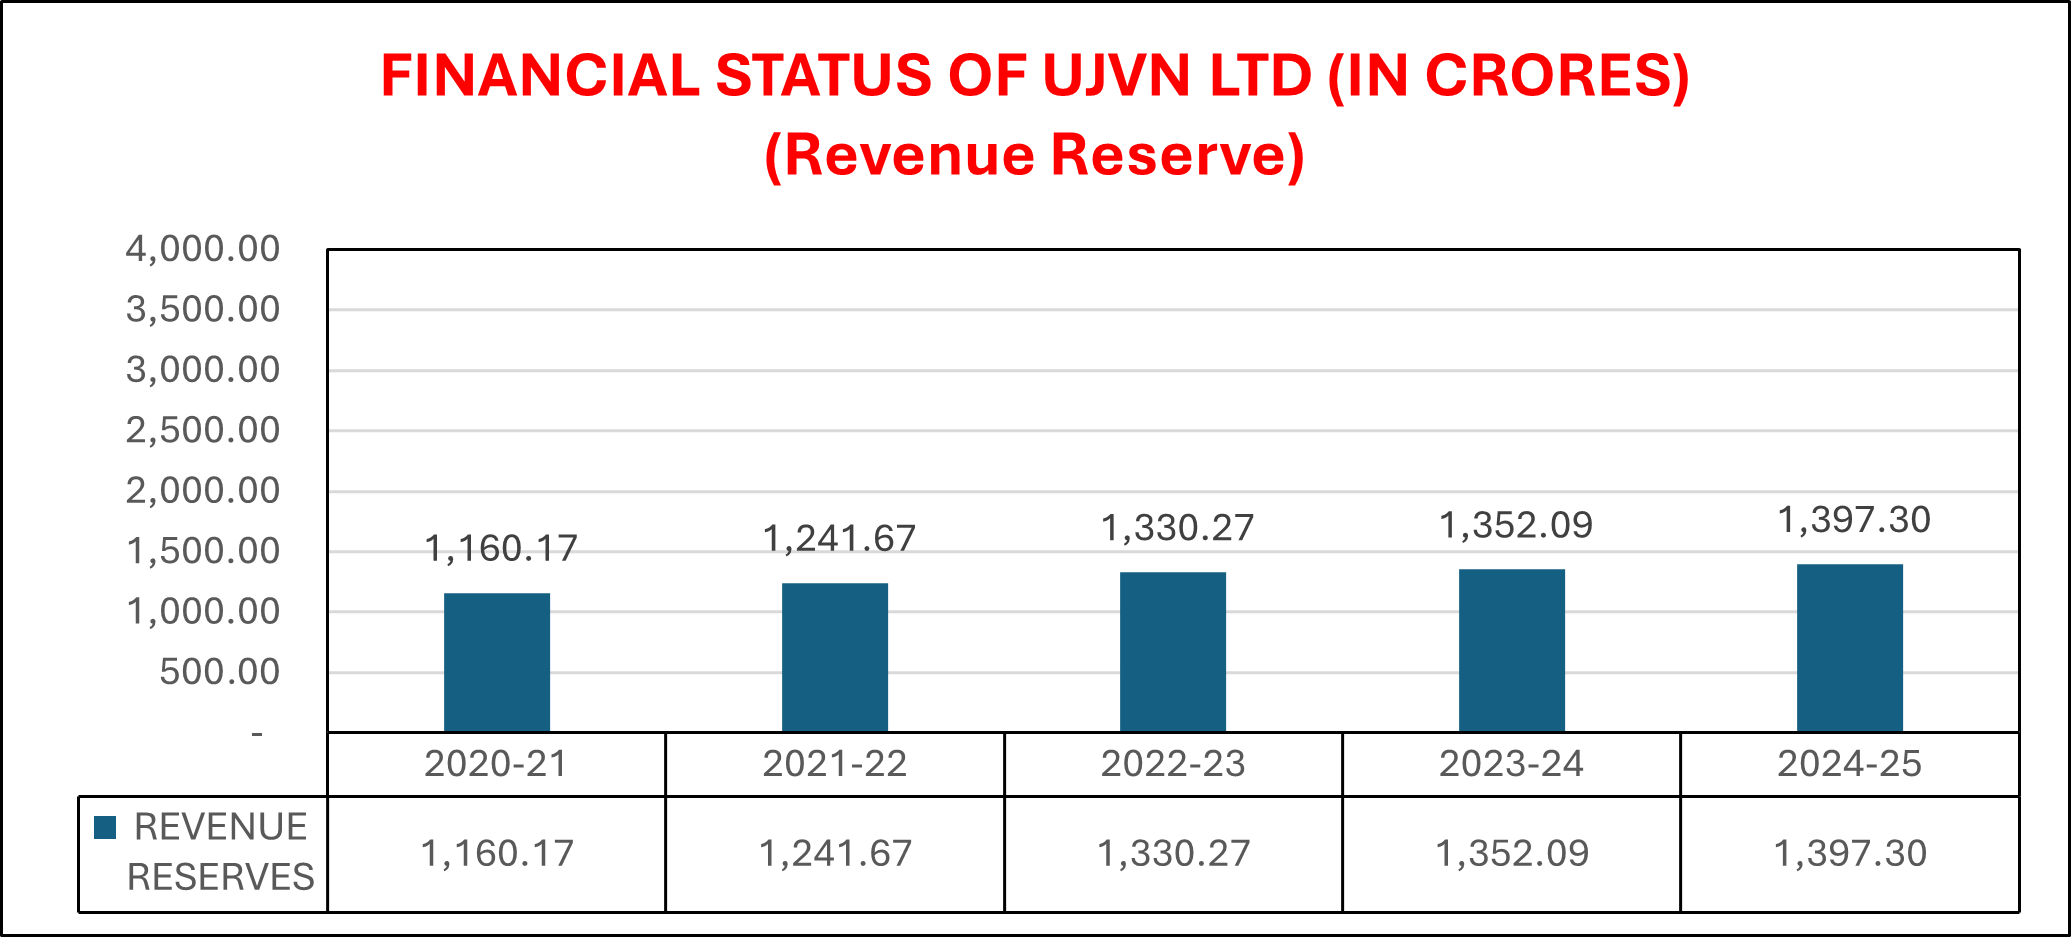
| Particulars | Revenue Reserves |
|---|---|
| 2024-25 | 1397.30 |
| 2023-24 | 1352.09 |
| 2022-23 | 1330.27 |
| 2021-22 | 1241.67 |
| 2020-21 | 1160.17 |
| 2019-20 | 1053.09 |
| 2018-19 | 939.86 |
| 2017-18 | 570.55 |
| 2016-17 | 388.23 |
| 2015-16 | 423.02 |
| 2014-15 | 259.48 |
| 2013-14 | 255.64 |
| 2012-13 | 242.51 |
| 2011-12 | 225.99 |
| 2010-11 | 169.51 |
| 2009-10 | 152.29 |
| 2008-09 | 140.93 |
| 2007-08 | 114.45 |
| 2006-07 | 63.87 |
| 2005-06 | 15.47 |
| 2004-05 | 0.00 |
| 2003-04 | 0.00 |
| 2002-03 | 0.00 |
| 2001-02 | 0.00 |
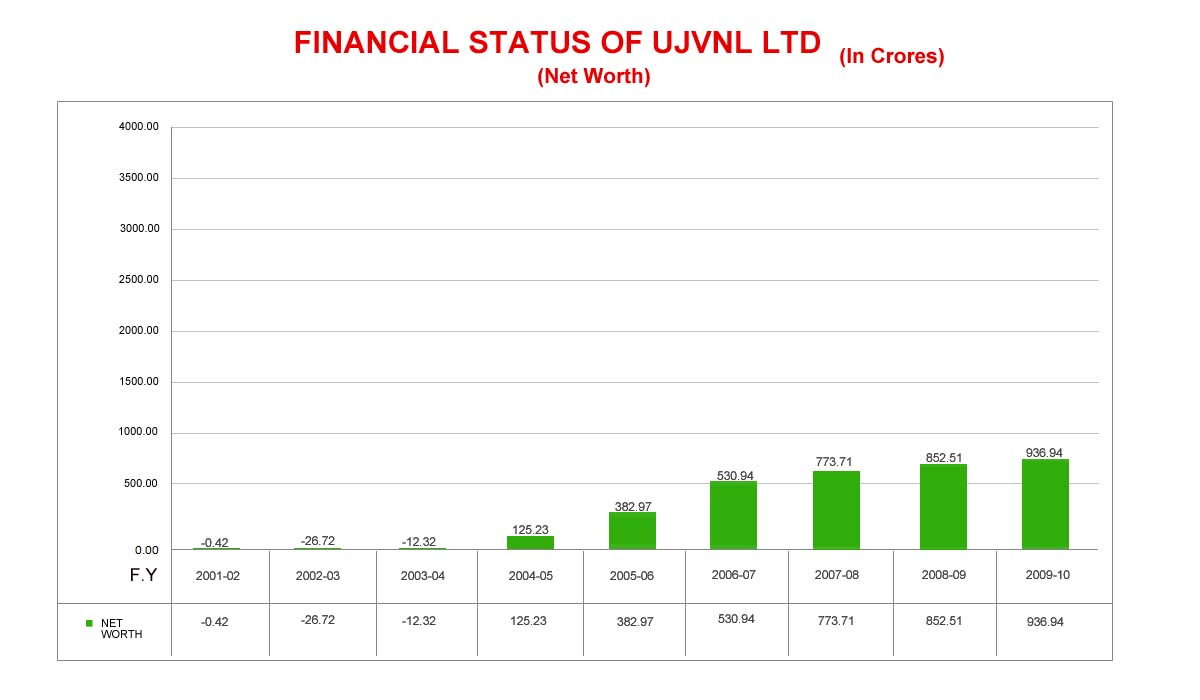
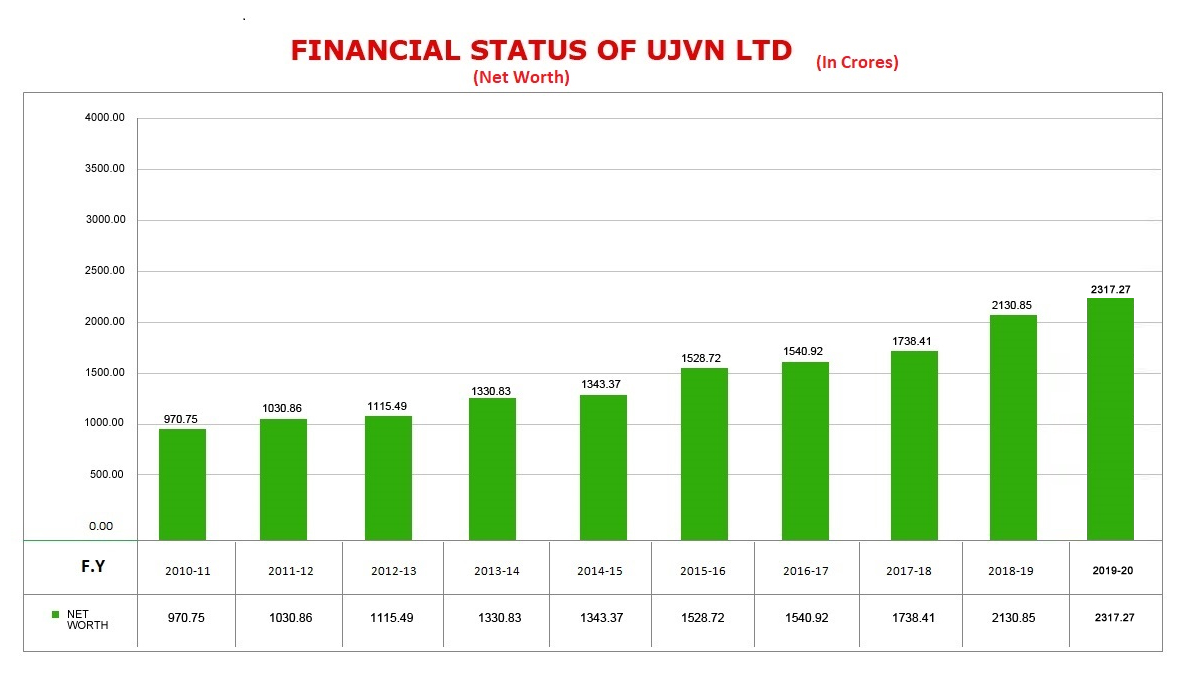
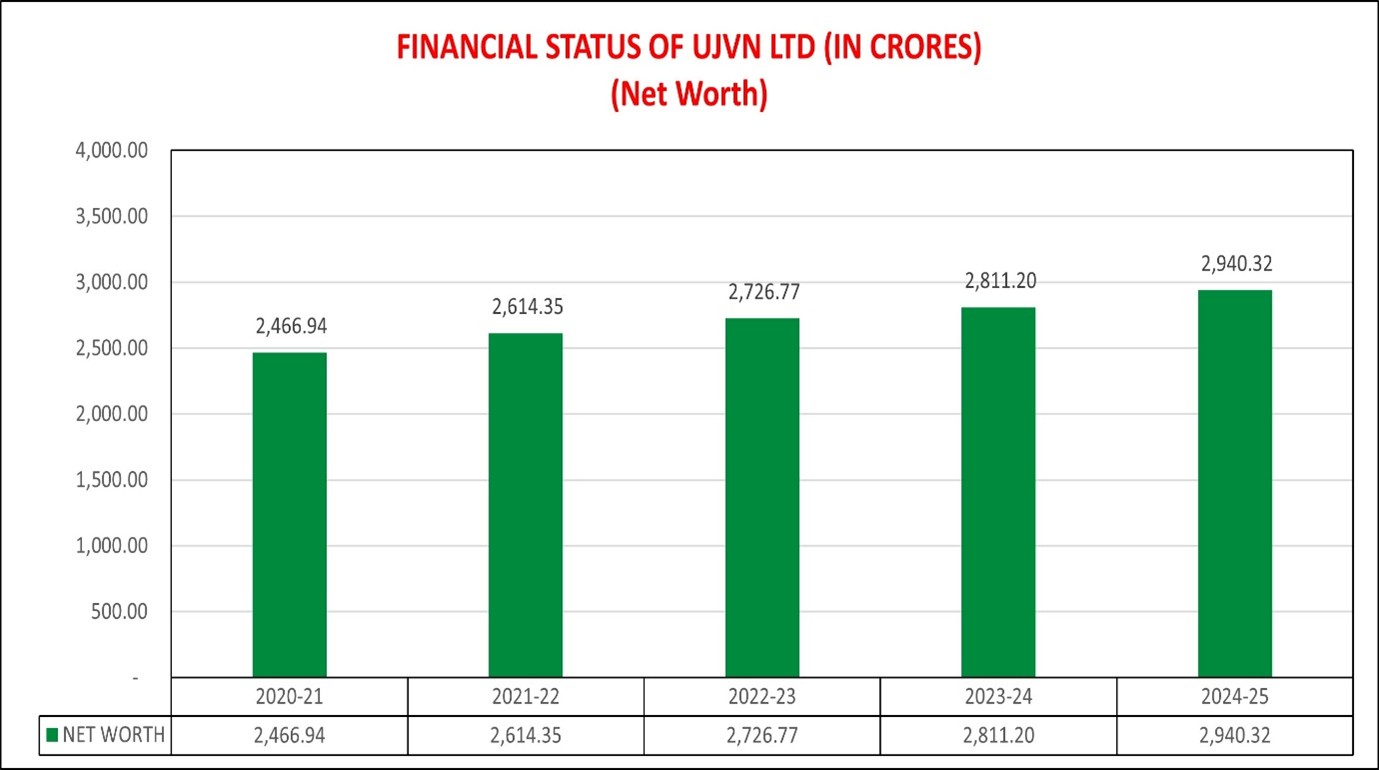
| Particulars | Net Worth |
|---|---|
| 2024-25 | 2940.32 |
| 2023-24 | 2811.20 |
| 2022-23 | 2726.77 |
| 2021-22 | 2614.35 |
| 2020-21 | 2466.94 |
| 2019-20 | 2317.27 |
| 2018-19 | 2130.85 |
| 2017-18 | 1738.41 |
| 2016-17 | 1540.92 |
| 2015-16 | 1528.72 |
| 2014-15 | 1343.37 |
| 2013-14 | 1330.83 |
| 2012-13 | 1115.49 |
| 2011-12 | 1030.86 |
| 2010-11 | 970.75 |
| 2009-10 | 936.94 |
| 2008-09 | 852.51 |
| 2007-08 | 773.71 |
| 2006-07 | 530.94 |
| 2005-06 | 382.97 |
| 2004-05 | 125.23 |
| 2003-04 | -12.32 |
| 2002-03 | -26.72 |
| 2001-02 | -0.42 |
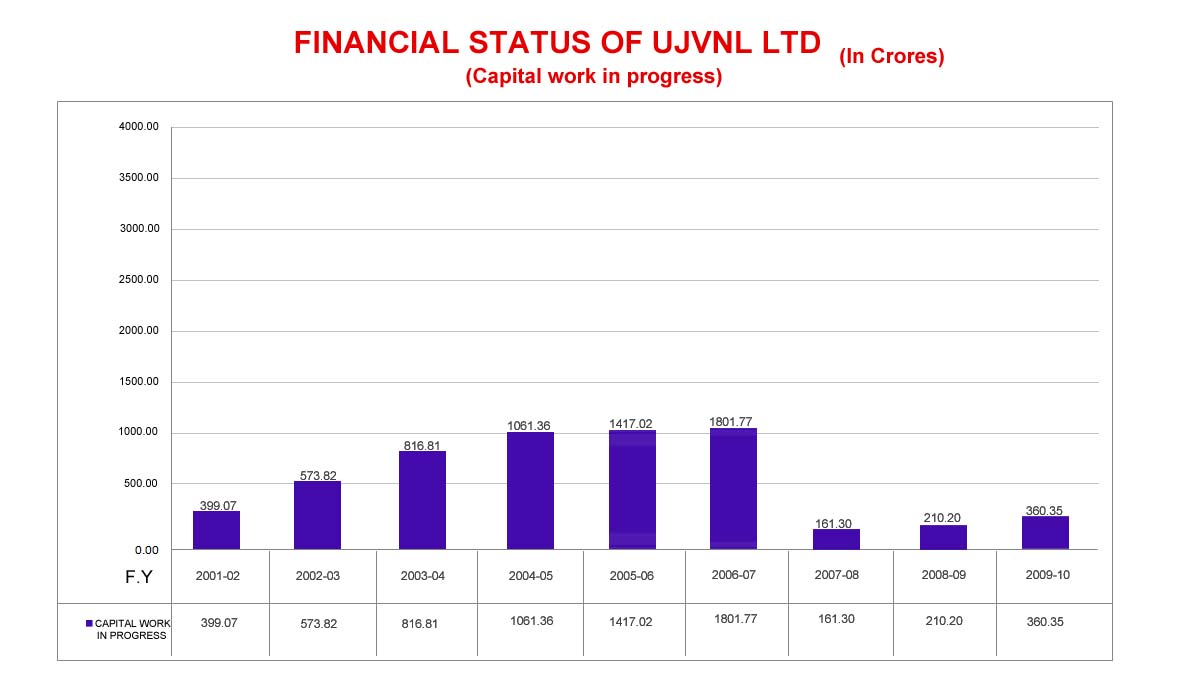
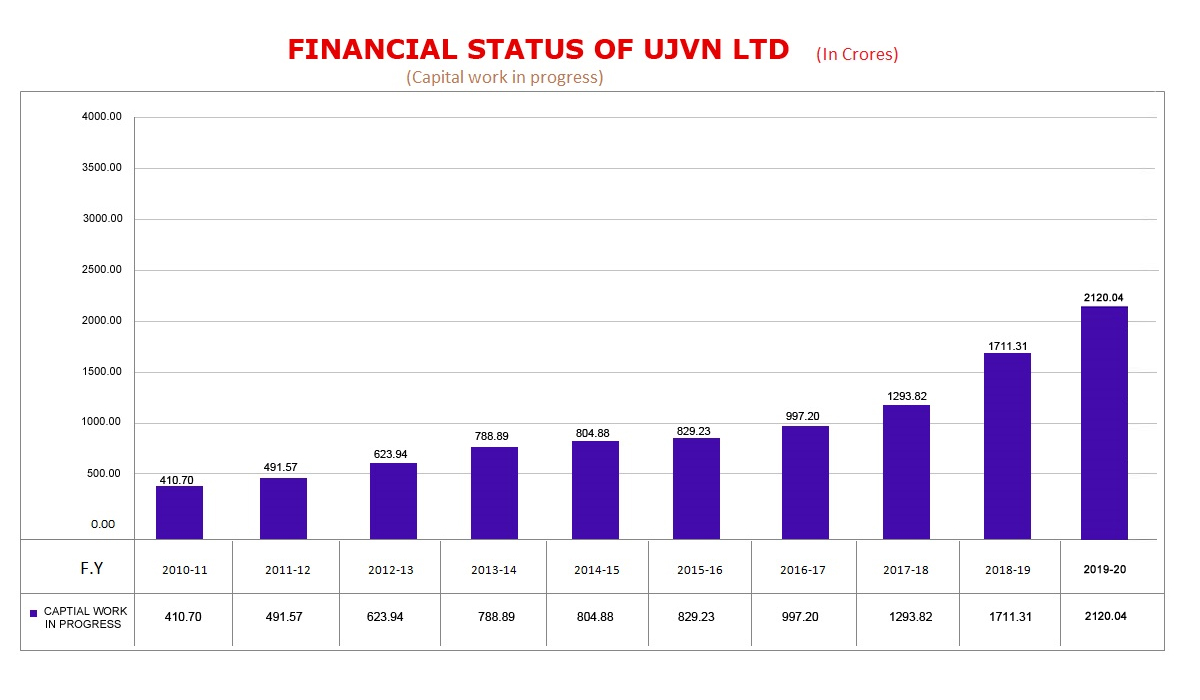
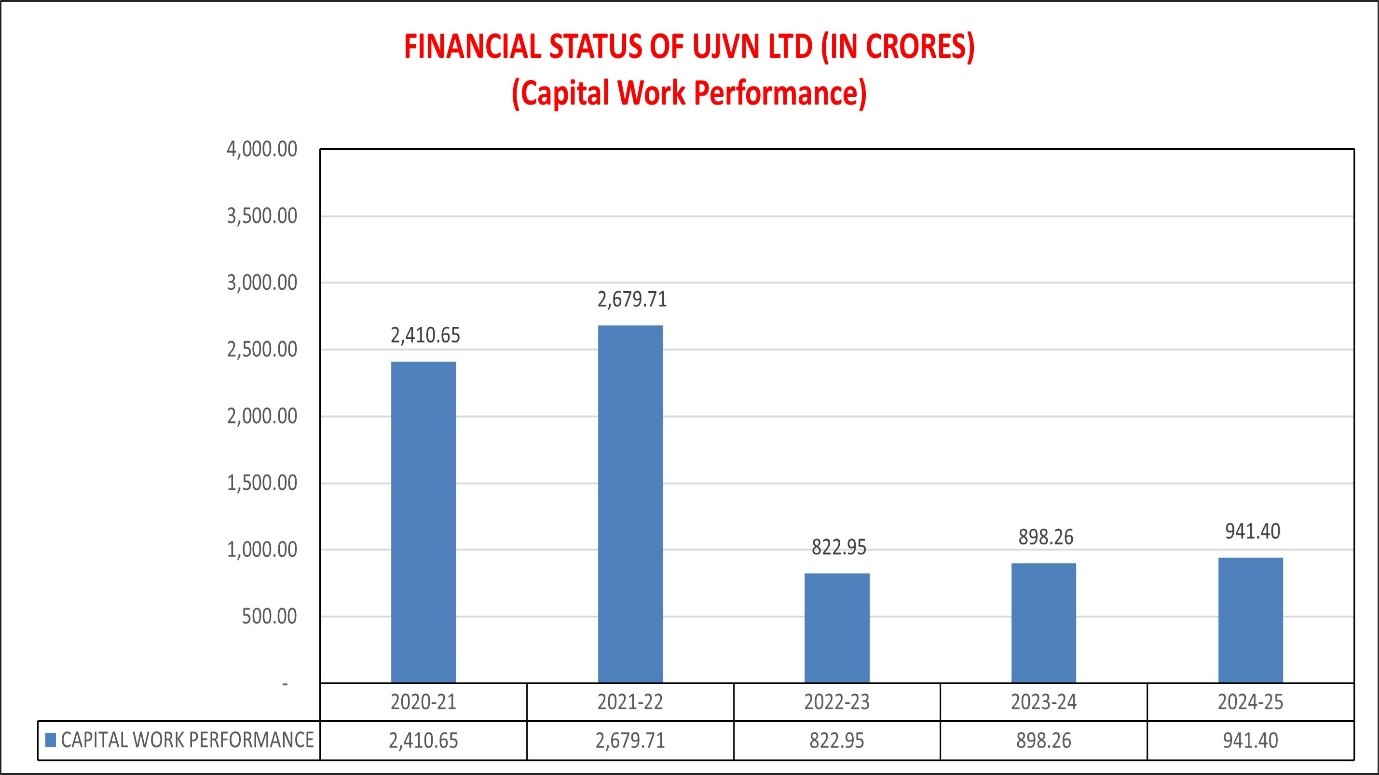
| Particulars | Capital Work Performance |
|---|---|
| 2024-25 | 941.40 |
| 2023-24 | 898.26 |
| 2022-23 | 822.95 |
| 2021-22 | 2679.71 |
| 2020-21 | 2410.65 |
| 2019-20 | 2120.04 |
| 2018-19 | 1711.31 |
| 2017-18 | 1293.82 |
| 2016-17 | 997.20 |
| 2015-16 | 829.23 |
| 2014-15 | 804.88 |
| 2013-14 | 788.99 |
| 2012-13 | 623.94 |
| 2011-12 | 491.57 |
| 2010-11 | 410.70 |
| 2009-10 | 360.35 |
| 2008-09 | 210.20 |
| 2007-08 | 161.30 |
| 2006-07 | 1801.77 |
| 2005-06 | 1417.02 |
| 2004-05 | 1061.36 |
| 2003-04 | 816.81 |
| 2002-03 | 573.82 |
| 2001-02 | 399.07 |
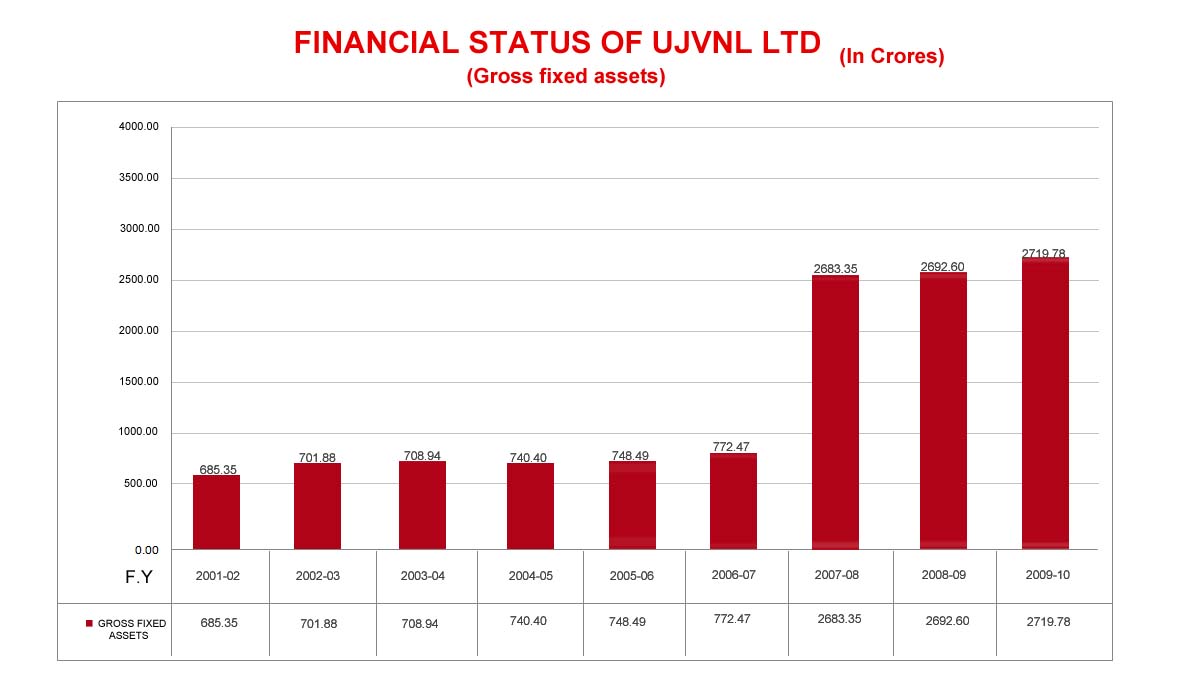
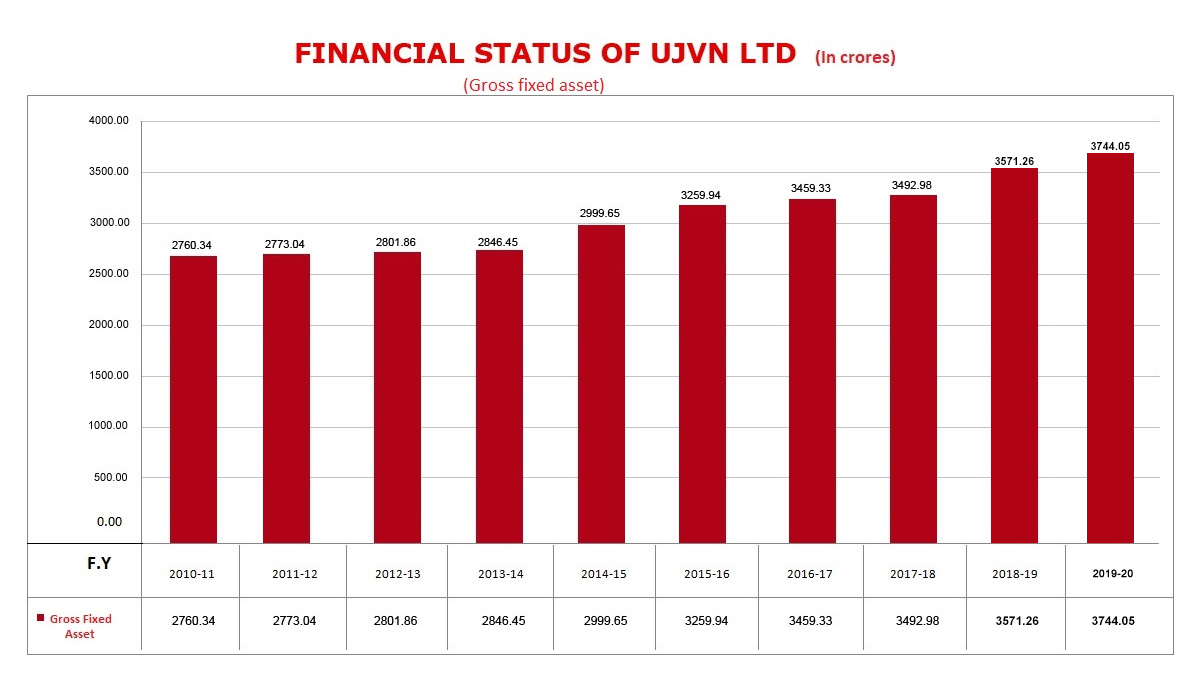
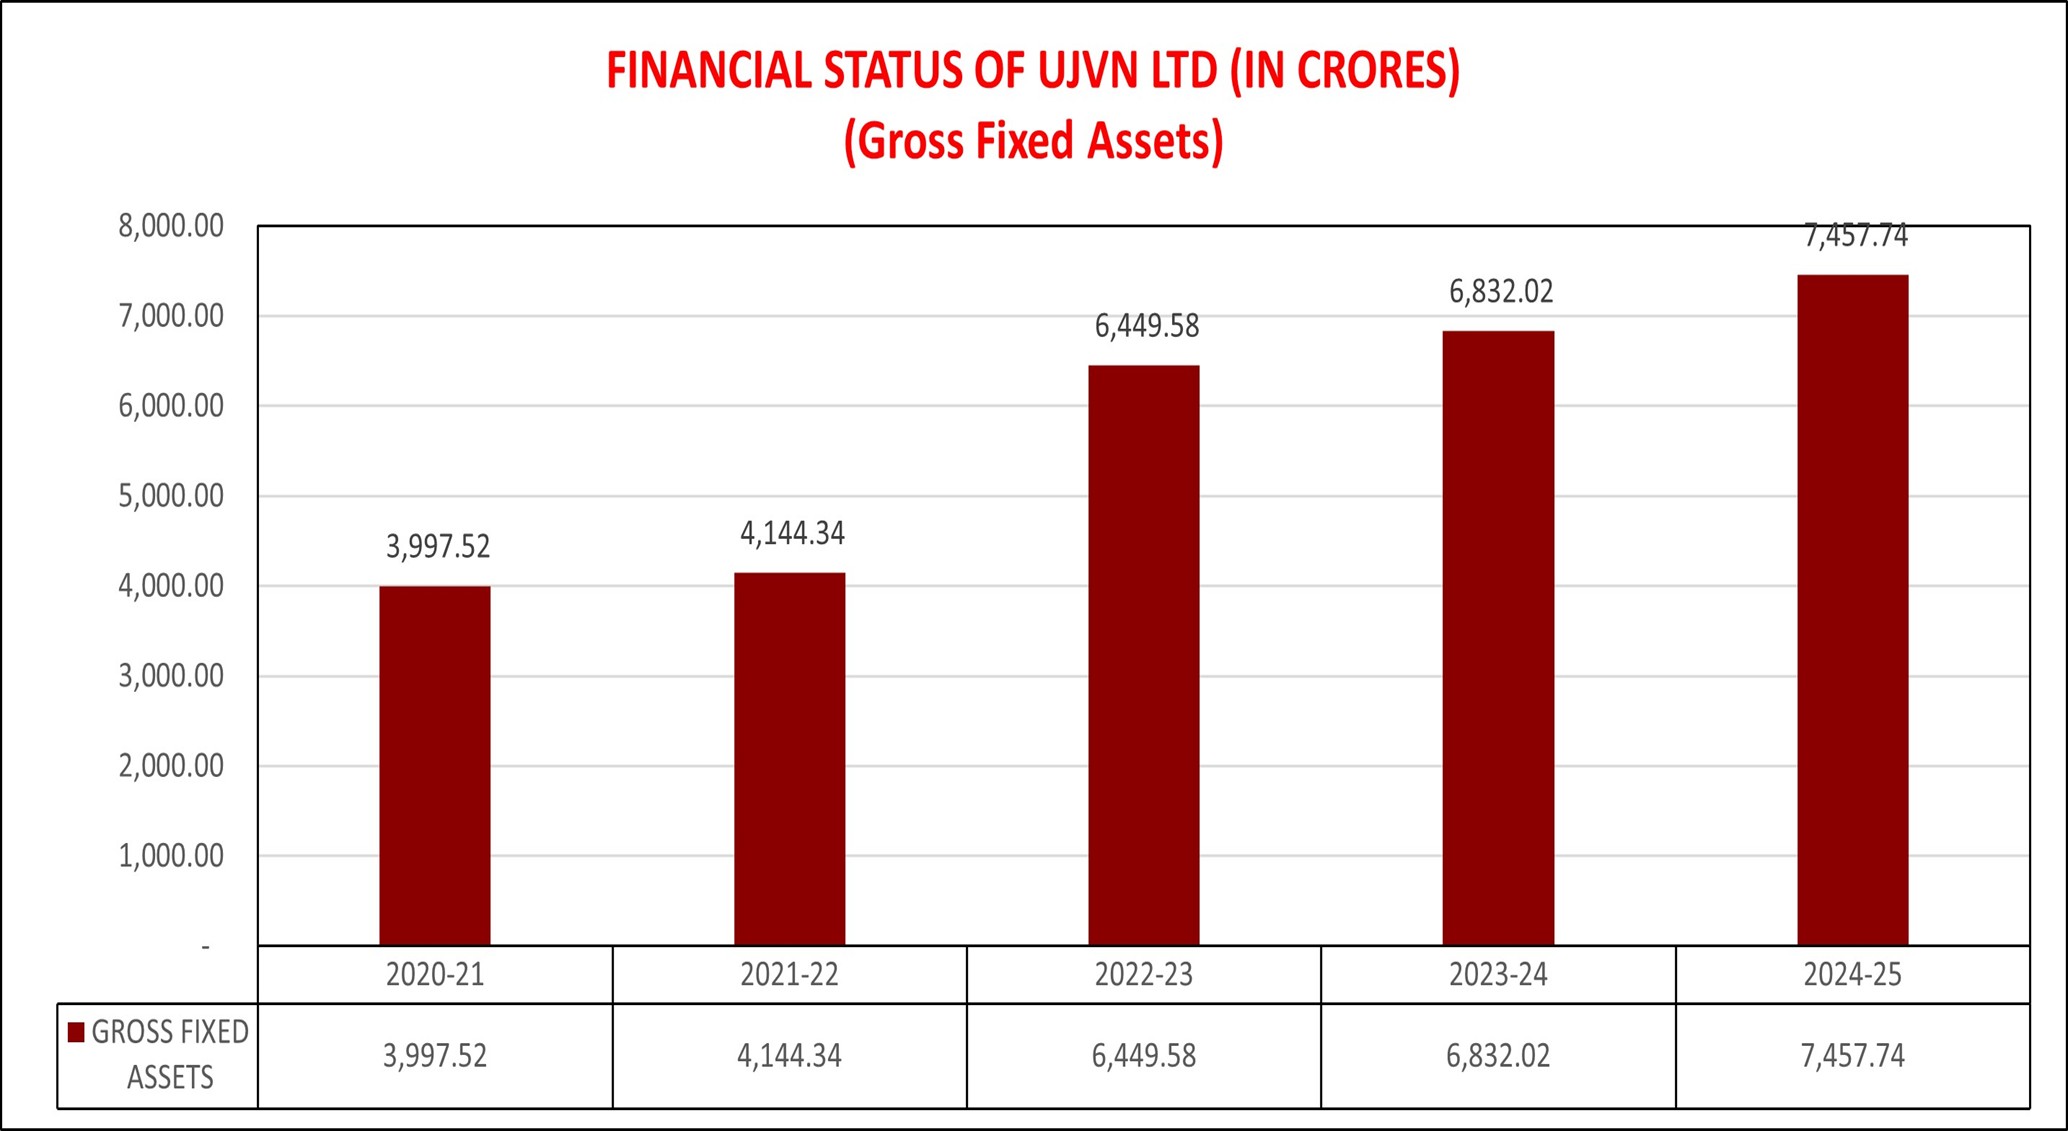
| Particulars | Gross Fixed Assets |
|---|---|
| 2024-25 | 7457.74 |
| 2023-24 | 6832.02 |
| 2022-23 | 6449.58 |
| 2021-22 | 4144.34 |
| 2020-21 | 3997.52 |
| 2019-20 | 3744.05 |
| 2018-19 | 3571.26 |
| 2017-18 | 3492.98 |
| 2016-17 | 3459.33 |
| 2015-16 | 3259.94 |
| 2014-15 | 2999.65 |
| 2013-14 | 2846.45 |
| 2012-13 | 2801.86 |
| 2011-12 | 2773.04 |
| 2010-11 | 2760.34 |
| 2009-10 | 2719.78 |
| 2008-09 | 2692.60 |
| 2007-08 | 2683.35 |
| 2006-07 | 772.47 |
| 2005-06 | 748.49 |
| 2004-05 | 740.40 |
| 2003-04 | 708.94 |
| 2002-03 | 701.88 |
| 2001-02 | 685.35 |
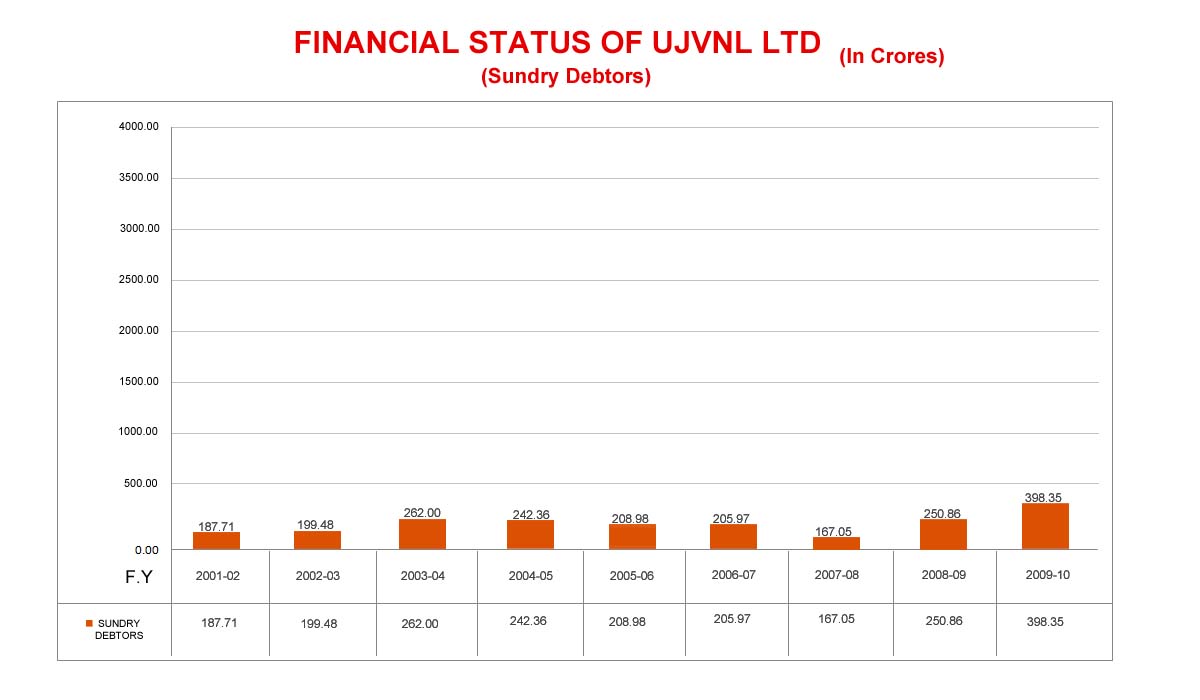
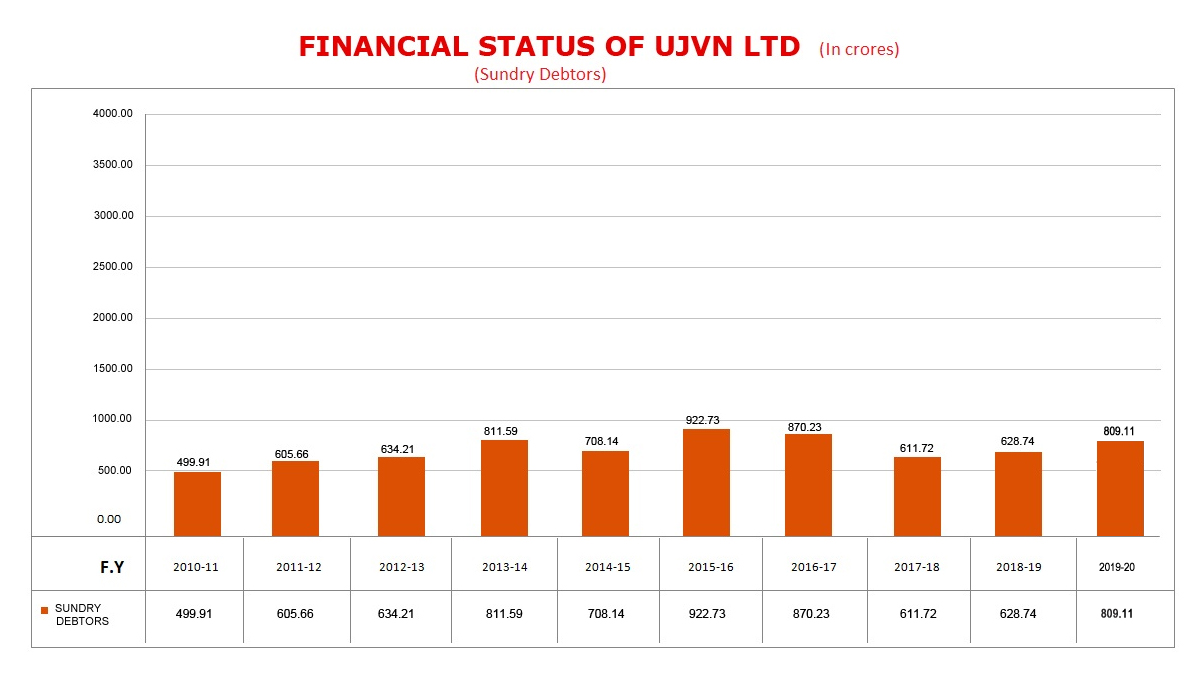
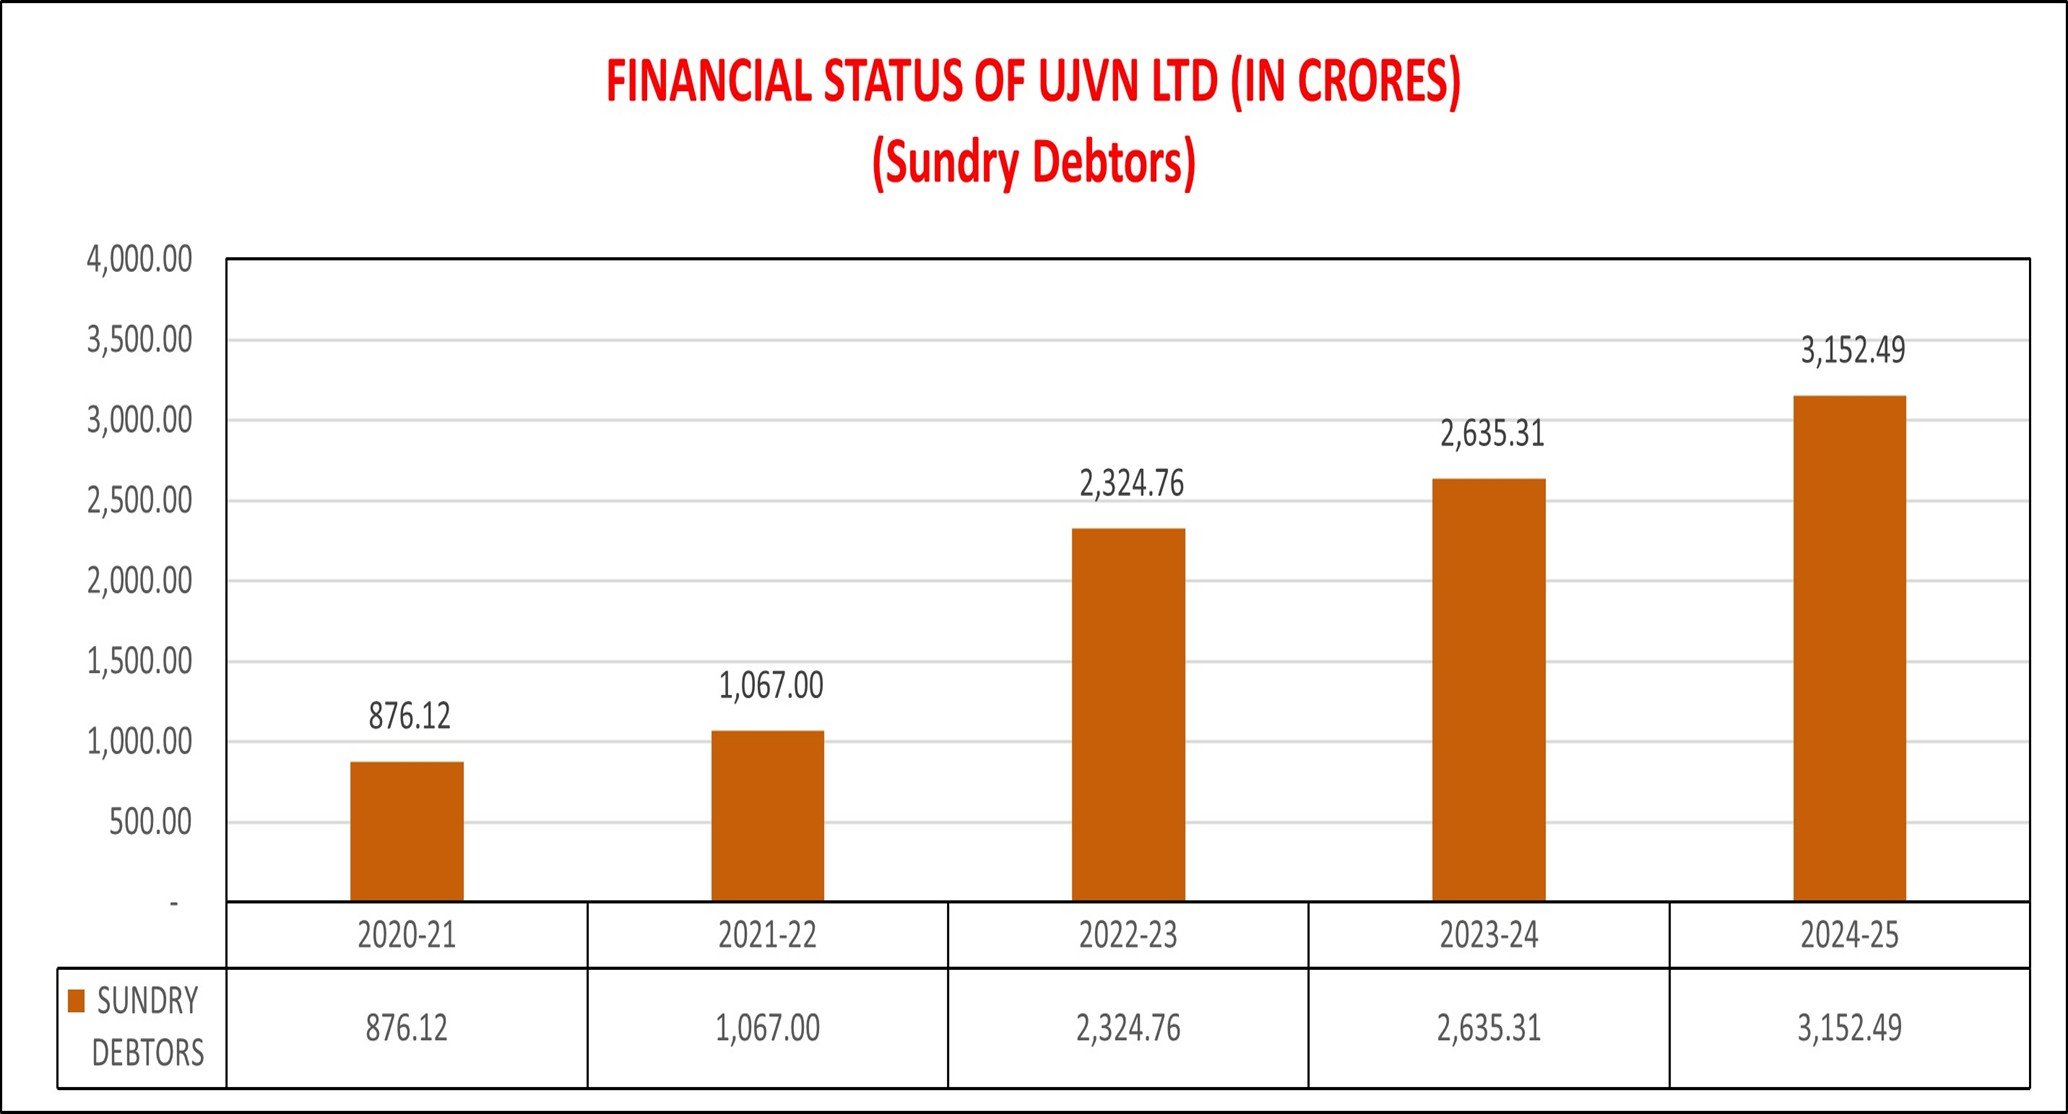
| Particulars | Sundry Debtors |
|---|---|
| 2024-25 | 3152.49 |
| 2023-24 | 2635.31 |
| 2022-23 | 2324.76 |
| 2021-22 | 1067.00 |
| 2020-21 | 876.12 |
| 2019-20 | 809.11 |
| 2018-19 | 628.74 |
| 2017-18 | 611.72 |
| 2016-17 | 870.23 |
| 2015-16 | 922.73 |
| 2014-15 | 708.14 |
| 2013-14 | 811.59 |
| 2012-13 | 634.21 |
| 2011-12 | 605.66 |
| 2010-11 | 499.91 |
| 2009-10 | 398.35 |
| 2008-09 | 250.86 |
| 2007-08 | 167.05 |
| 2006-07 | 205.97 |
| 2005-06 | 208.98 |
| 2004-05 | 242.36 |
| 2003-04 | 262.00 |
| 2002-03 | 199.48 |
| 2001-02 | 187.71 |
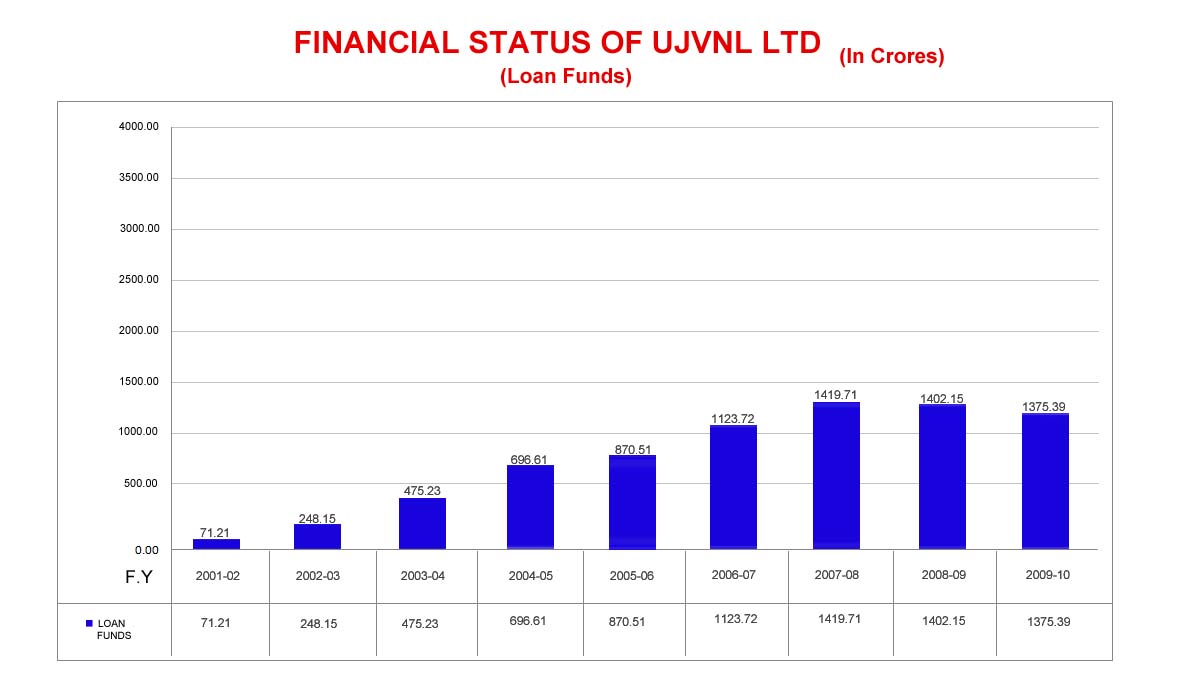
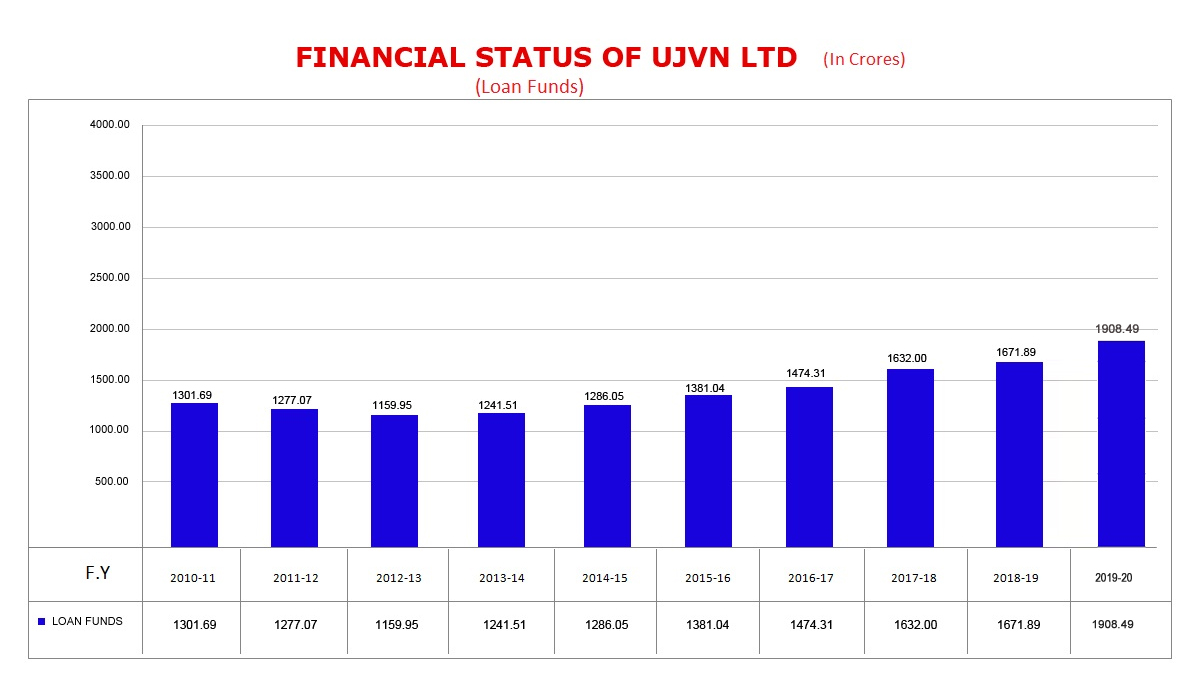
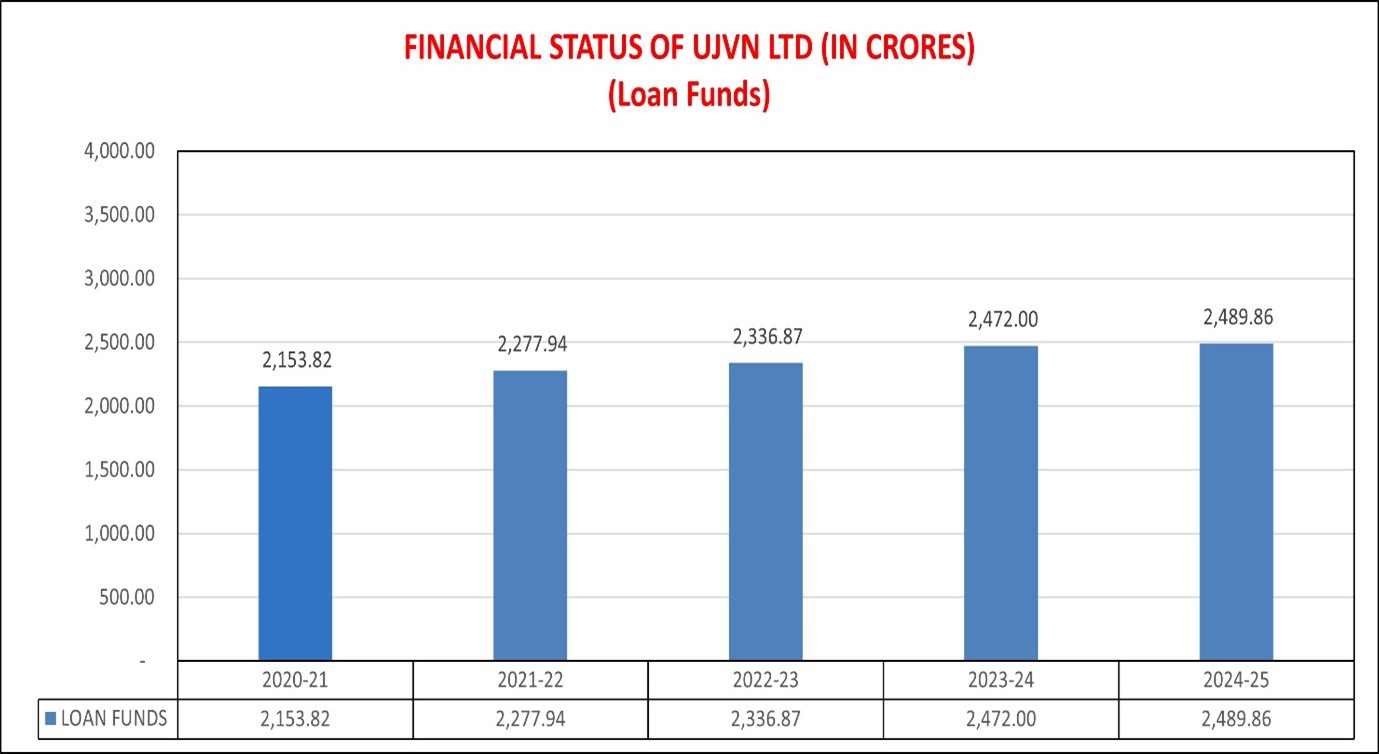
| Financial Year | Loan Funds(in Cr.) |
|---|---|
| 2024-25 | 2489.86 |
| 2023-24 | 2472.00 |
| 2022-23 | 2336.87 |
| 2021-22 | 2277.94 |
| 2020-21 | 2153.82 |
| 2019-20 | 1908.49 |
| 2018-19 | 1671.89 |
| 2017-18 | 1632.00 |
| 2016-17 | 1474.31 |
| 2015-16 | 1381.07 |
| 2014-15 | 1286.05 |
| 2013-14 | 1241.51 |
| 2012-13 | 1159.95 |
| 2011-12 | 1227.07 |
| 2010-11 | 1301.69 |
| 2009-10 | 1375.39 |
| 2008-09 | 1402.15 |
| 2007-08 | 1419.71 |
| 2006-07 | 1123.72 |
| 2005-06 | 870.51 |
| 2004-05 | 696.61 |
| 2003-04 | 475.23 |
| 2002-03 | 248.15 |
| 2001-02 | 71.21 |